The Debugger is a powerful tool for checking your game, and is especially useful for tracking down errors and bugs in your code, as well as checking that scripts are run when they should be, and that variables and arrays contain the values you expect, etc. You can start the Debugger by running your game from GameMaker IDE using the Debug button ![]() at the top of the IDE, or by going to the Build menu and selecting "Debug".
at the top of the IDE, or by going to the Build menu and selecting "Debug".
NOTE You may be prompted by Windows Firewall (or any other firewall program that you run) to create a security exception for this module. You must do this otherwise it will not work correctly. This is due to the way the Debugger works and is essential for debugging mobile platforms.
NOTE On some systems you may see a very small memory increase due to the way that GameMaker measures memory usage.
When you run a game in debug mode, the IDE will display the different tools available for the Debugger:
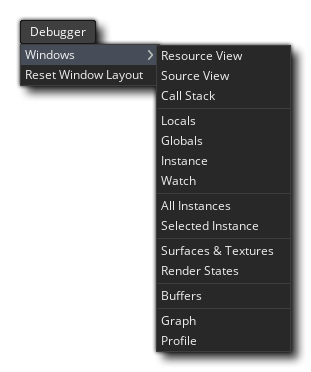
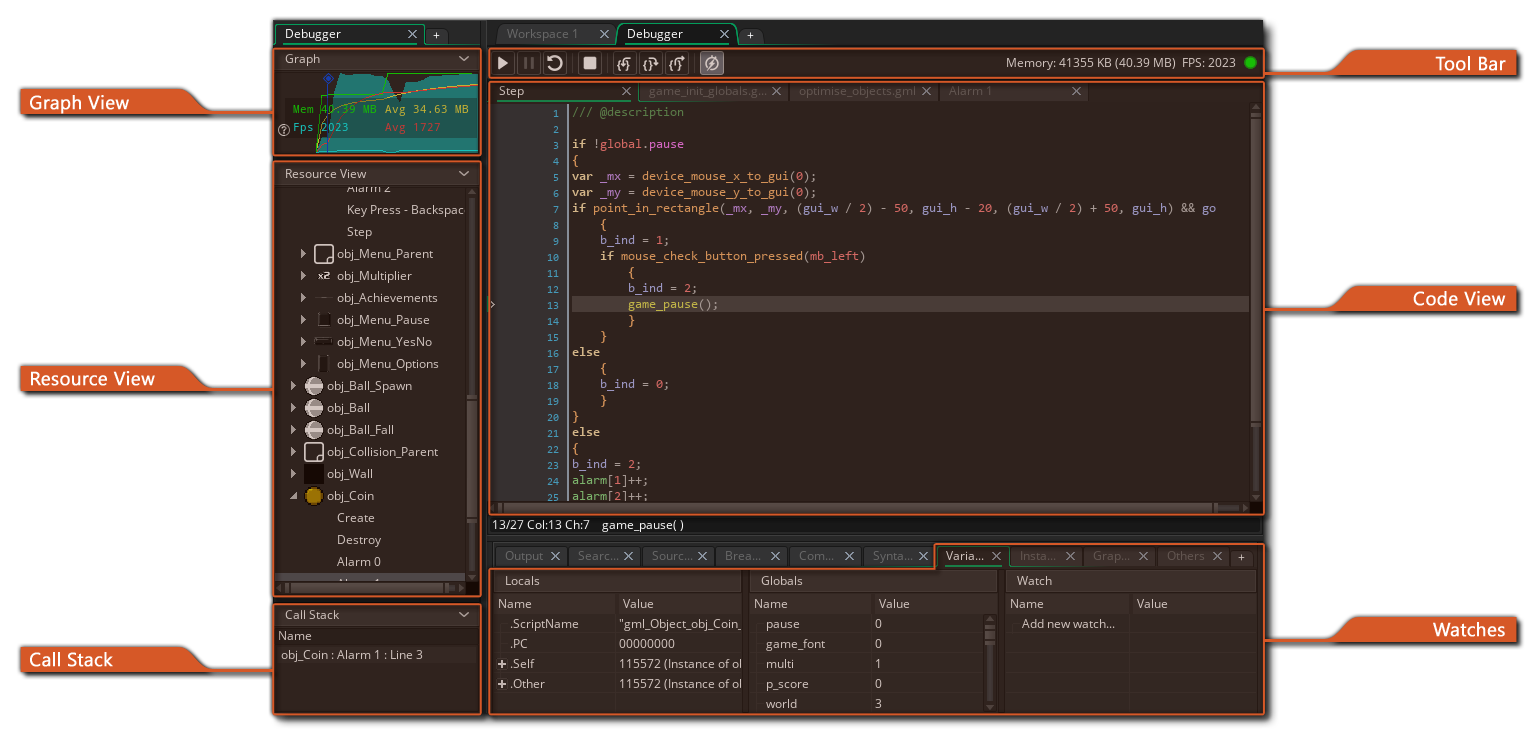 The image shown above shows the default layout for the debugger, but as with other aspects of the IDE you can customise this to suit your needs, closing windows you don't need or changing the sizes of the docs and windows that you do need. You can reset the debugger layout at any time - or reopen closed windows - from the Debugger context menu at the top of the IDE:
 Below we explain what each section of the debugger is for:
The Graph view shows you a graphic display of how your project is using memory and its framerate over time:
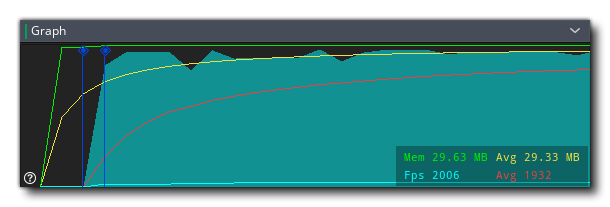 The graph shows the current and average memory use as well as the current and average FPS over time, and you can zoom in or out using the
 ![]() /
/ ![]() along with the mouse wheel
along with the mouse wheel ![]() , and if you position the mouse cursor over any of the graph elements, it will show you the value for that element at the selected point.
, and if you position the mouse cursor over any of the graph elements, it will show you the value for that element at the selected point.
The Graph view will also show certain debug events as points along the length of the graph. These events are generated automatically by GameMaker at certain points in the running of a game to show specific important events, but you can also add in your own graph elements using the functions show_debug_message() and debug_event(). System events will be flagged in a different colour to those events that are triggered through code:
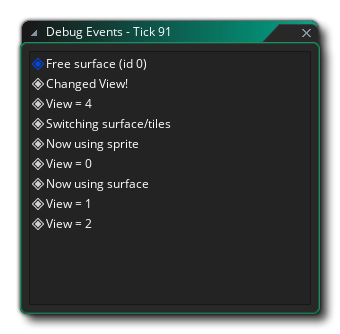
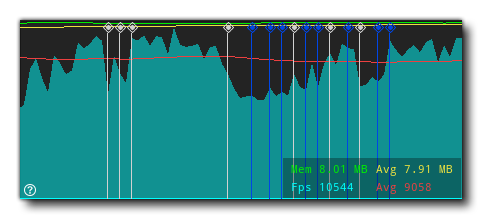 When running the game in debug and mousing over these events, a list will be shown of all the events that were triggered at that point in the game, and you have the option of pulling the list out into a separate window for revising by clicking the "Click to open in a new window" text:
The Resource View shows you a list of all the resources being used in the project that can contain code or GML Visual actions. This section works much like the Asset Browser and you can expand the items in it to show more information, for example, the different events for a specific object. You can then double click ![]() on any of the resources to open the code for it in the Code View window, where you can check values and add or remove breakpoints.
on any of the resources to open the code for it in the Code View window, where you can check values and add or remove breakpoints.
This window will display the current call stack of events, as well as the line number for the code being stepped through. The call stack is essentially a "last in - first out" data structure that shows the order of execution of all the game code both from the GameMaker runner - since debugging is done using the Virtual Machine (VM) - and from what you have written for the game. The debugger will need to have been Paused before any information will be shown here.
The toolbar has the debugger controls along with some basic information such as memory use, the current (real) FPS for the game and an indicator to show whether the debugger is currently connected or not (the indicator will be green when connected to a running instance of your project and red otherwise). The available controls are:
| This starts the game again after it has been paused (keyboard shortcut "f5"). | |
| This will pause (break) the game. | |
| Restarts the game. | |
| Stops the game. | |
| Step into a code block or script (keyboard shortcut "f11"). | |
| Step over a code block or script (keyboard shortcut "f10"). | |
| Step out of a code block or script (keyboard shortcut | |
| Turn on or off real time updates for the debug information (this is off by default). |
The first three buttons are used to control your game, permitting you to start, pause, restart or stop it at any time. When the game is paused (either by clicking the Pause button or from a Breakpoint) you can then use the three step buttons for stepping through your code.
When we talk about "stepping" through the code, we simply mean that you can tell your game to run the current line of code, then "step" onto the next one, permitting you to run through your entire game one line of code at a time should you wish. Normally you would simply use the Step In button to do this, but you also have one for stepping over code and one for stepping out of the code. Stepping over is useful when you have large scripts to run through, as clicking this will run the whole script or code block as a single step and stop on the next line afterwards, while stepping out will take you out of a script (they will run, but all at once) and stop on the next step afterwards when the scope changes.
The final icon for real time updates permits the debug window to update its data in real time, so you can see how variables change or instances are created and destroyed as it happens. Note that this may affect the games performance and that not all information is available in real time. For example, the Render State watch (see the section on Watches) cannot be viewed in real time.
The code view is where we can see and review different scripts or event code from our project as it runs. By default this starts empty, but you can double click ![]() on any asset from the Resource View to open it here. You can open multiple different events or scripts too, and they will be added to the Code View workspace as tabs along the top.
on any asset from the Resource View to open it here. You can open multiple different events or scripts too, and they will be added to the Code View workspace as tabs along the top.
While any code window is open in the Code View, you can left click ![]() in the gutter (where the line numbers are) to add or remove Breakpoints (see further down this page for information on breakpoints).
in the gutter (where the line numbers are) to add or remove Breakpoints (see further down this page for information on breakpoints).
You can also use the right mouse button ![]() to open the Context Menu, which also permits you to add or remove breakpoints and copy any selected code to the clipboard.
to open the Context Menu, which also permits you to add or remove breakpoints and copy any selected code to the clipboard.
This section is dedicated to "watching" different aspects of your game to permit more in depth and detailed debugging. This is covered in depth on the following page:
It is important to note that while the game is running it doesn't update the debug windows with variable values and other details by default, therefore you must first either use the Pause button ![]() in the Debugger to pause the game before Locals, Globals and other data will be available, or enable real-time updating from the icons at the top
in the Debugger to pause the game before Locals, Globals and other data will be available, or enable real-time updating from the icons at the top ![]() . The only exception to this rule is the Profile view, which updates in real time when enabled independently of the real-time switch, as it has its own on/off button. You can find full information on this view from the following page:
. The only exception to this rule is the Profile view, which updates in real time when enabled independently of the real-time switch, as it has its own on/off button. You can find full information on this view from the following page:
Another important part of debugging your game is the use of Breakpoints. A breakpoint is a place in your project code that you wish it to stop at so you can see what's going on. With the Debugger running, you can add or remove breakpoints at any time and in any code or script block by left clicking ![]() in the gutter (where the line numbers are), or you can use the right mouse button
in the gutter (where the line numbers are), or you can use the right mouse button ![]() to open the Context Menu, which also permits you to add or remove breakpoints:
to open the Context Menu, which also permits you to add or remove breakpoints:
 Breakpoints can also be set from the GameMaker IDE. When writing your project, they can be added or removed at any time using f9 (or using the right mouse button
 ![]() and selecting "toggle breakpoint"), either on an action in the object window (for GML Visual users), or on a line in a code editor window. Now, when you run your game in debug mode, it will pause at the point (or points) that you have defined.
and selecting "toggle breakpoint"), either on an action in the object window (for GML Visual users), or on a line in a code editor window. Now, when you run your game in debug mode, it will pause at the point (or points) that you have defined.
Breakpoints set from the IDE are saved along with your project and will persist over various runs until removed again, however if you add a breakpoint to your code in the Debugger, this will be lost after the module is closed, or a new test run started. Note that all breakpoints will appear in the Output Window where they can be enabled or disabled or even removed.